Dated public and private ranges, what moves the multiple, and a sample ARR priced at each one.
On this page
The short answer
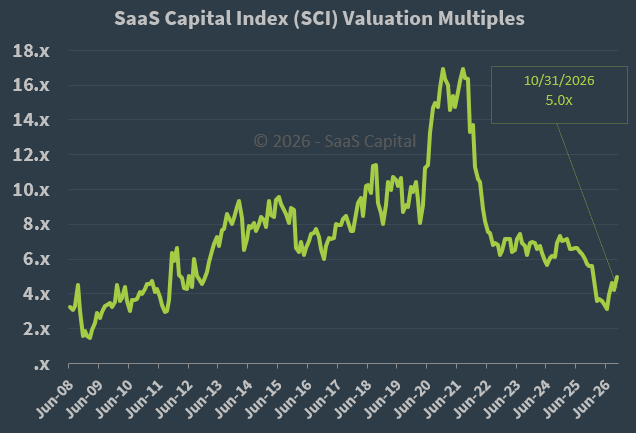
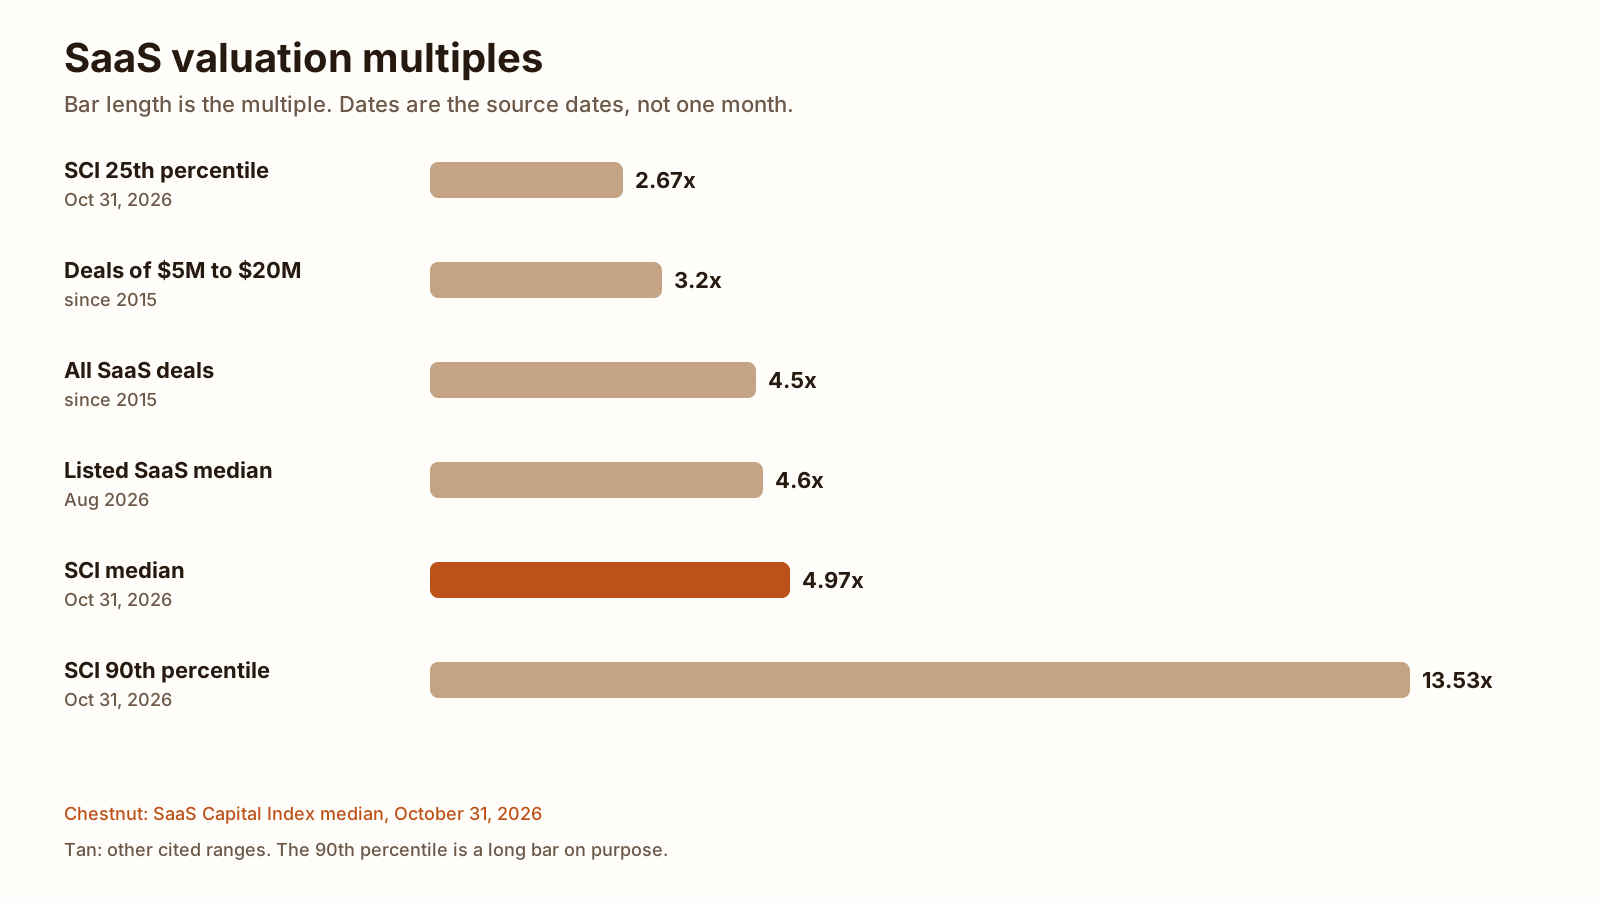
SaaS valuation multiples for public companies are about 5x right now. The SaaS Capital Index median ARR multiple was 4.97x on October 31, 2026, and the index chart labels that point 5.0x. Aventis Advisors puts the median listed SaaS company at 4.6x revenue in August 2026, and private SaaS deals of $5 million to $20 million at a 3.2x revenue median since 2015. A sample $1,000,000 of ARR at 4.97x is $4,970,000.00, and the same sample at that 3.2x revenue multiple is $3,200,000.00.
A revenue multiple is one line on the SaaS metrics page, beside ARR and the Rule of 40. This page is the dated ranges.
SaaS valuation multiples right now
Pick the 4.97x if you want the current public median with a date on it. Pick a size band from the private table if the company would sell for under $50 million. The 13.53x is the 90th percentile, not a typical deal.
The SaaS Capital figures below come from the downloadable file dated October 31, 2026, opened November 20, 2026. The median cell rounds to 4.97x. The chart on the index page labels the same point 5.0x. Aventis Advisors published the revenue multiples on August 31, 2026. Their listed median is August 2026. Their deal medians pool acquisitions since 2015.
| Reading | Multiple | As of | Source |
|---|---|---|---|
| SaaS Capital Index median | 4.97x | October 31, 2026 | Index file |
| SaaS Capital Index chart label | 5.0x | October 31, 2026 | Index chart |
| SaaS Capital Index 25th percentile | 2.67x | October 31, 2026 | Index file |
| SaaS Capital Index 90th percentile | 13.53x | October 31, 2026 | Index file |
| SaaS Capital Index median | 3.13x | June 30, 2026 | Index file |
| SaaS Capital Index median | 4.81x | January 31, 2026 | Index file |
| Listed SaaS median | 4.6x revenue | August 2026 | Aventis Advisors |
| Listed SaaS low | 3.2x revenue | June 2026 | Aventis Advisors |
| SaaS acquisitions, all sizes | 4.5x revenue | Deals since 2015 | Aventis, 543 deals |
| SaaS acquisitions | 3.8x revenue | 2025 | Aventis Advisors |
| SaaS acquisitions | 3.1x revenue | Q1 2026 | Aventis Advisors |
The index multiple is market cap divided by annualized current run-rate revenue. SaaS Capital’s index page defines that run rate as the most recent month of GAAP revenue times 12. GAAP revenue is all reported revenue, from whatever source. It is not subscription ARR unless the company has nothing else in the accounts.
Public vs private SaaS multiples
Pick the October 31, 2026 public median if you are comparing a company with listed B2B SaaS. Pick the private size band if you are pricing a sale. The public 4.97x and the private 3.2x are not two readings of the same deal.
Aventis splits EV/Revenue by deal size. Up to $50 million, the median stays near 3x. Over $50 million it steps up. The page says a company with $2 million to $15 million of revenue would sell for roughly $5 million to $50 million at about 3x, which is the band most of the companies they work with fall in.
| Deal size | 1st quartile | Median | 3rd quartile |
|---|---|---|---|
| Under $5 million | 1.8x | 3.3x | 5.7x |
| $5 million to $20 million | 1.7x | 3.2x | 5.8x |
| $20 million to $50 million | 2.0x | 3.0x | 4.8x |
| $50 million to $100 million | 2.8x | 6.1x | 9.7x |
| $100 million to $500 million | 2.8x | 5.1x | 9.5x |
| $500 million and over | 4.0x | 6.2x | 9.6x |
SaaS Capital’s private predictions are older than that file. On January 24, 2025, with the public index at 7.0x, they predicted 4.8x for a bootstrapped private company and 5.3x for an equity-backed one. The same note expected public multiples to stay in a band of 5.5x to 8x. The October 31, 2026 median of 4.97x sits under that band. Those 4.8x and 5.3x figures are not a reading of the October 2026 market.
What moves the multiple
Size is the split in the table above. Growth, profit, the Rule of 40, and retention are the other levers Aventis names, from listed companies that publish the figures.
In Q2 2026 the median listed SaaS company in their sample grew 11.8%. The median EBITDA margin, averaged over the previous four quarters, was 11.1%. The Rule of 40 score, growth plus EBITDA margin, had a median of 26%, and only 7 of the 46 companies that report both figures cleared 40. A private company that clears 40 will stand out against that median. The score itself is the Rule of 40 calculator.
Retention over 100% means the customers who stay add more revenue than the ones who leave take away. Aventis says that raises the price, and that a handful of large customers works the other way. The rate for one starting group is the NRR calculator. They do not publish a multiple point per point of NRR. Neither does the SaaS Capital index file.
Gross margin is a different line from EBITDA margin. What goes into it is SaaS gross margin. Aventis does not publish a revenue-multiple step for gross margin. None of the sources above publishes one.
Revenue vs EBITDA multiples
Pick a revenue multiple if the company is still reinvesting and profit says little about the price. Pick an EBITDA multiple if the buyer is pricing a profitable company, and use a deal-size band close to yours. Aventis says many SaaS companies reinvest so heavily that buyers start from revenue.
| Reading | Median | Sample |
|---|---|---|
| SaaS EV/Revenue, deals since 2015 | 4.5x | 543 deals, middle half 2.4x to 8.1x, median deal $80 million |
| SaaS EV/EBITDA, deals since 2015 | 23.0x | 232 deals, middle half 12.8x to 47.1x, median deal $181 million |
| Private software EBITDA, $5 million to $20 million | 9.5x | 126 deals since 2015 |
| Private software EBITDA, $20 million to $50 million | 12.7x | 65 deals since 2015 |
Aventis says 23.0x EBITDA is the wrong yardstick if the company would sell for under $50 million. The closer EBITDA guide they print for that size is the all-software band, 9.5x or 12.7x, and those deals are not SaaS only.
ARR and revenue come apart when the denominator changes. SaaS Capital divides market cap by annualized GAAP revenue. Aventis uses enterprise value over revenue, and says the two multiples are close when revenue is almost all subscription. Where services or one-off licenses are a large share, the ARR multiple is higher than the revenue multiple, because the denominator is smaller. Which number you hand someone is MRR vs ARR.
Work out your own
The sample is $1,000,000 of ARR. That is the opening ARR on the valuation calculator, labeled here as a sample, not a company in either source. Applying a revenue multiple to ARR matches the revenue multiple only when ARR and revenue are the same number.
| Multiple | What it is | Sample value |
|---|---|---|
| 4.97x | SaaS Capital Index median, October 31, 2026 | $4,970,000.00 |
| 5.0x | Index chart label, same date | $5,000,000.00 |
| 4.6x | Aventis listed median, August 2026, revenue | $4,600,000.00 |
| 3.2x | Aventis deals of $5 million to $20 million, revenue | $3,200,000.00 |
| 5.87x | Calculator opening. 4.97x plus this site’s rule, not a market quote | $5,870,000.00 |
The 5.87x row is what the SaaS valuation calculator prints when it opens. The large figure is that row. The line labeled “At the median” is the 4.97x row. Growth, NRR, churn, and margin move the multiple by a rule this site wrote. SaaS Capital and Aventis do not publish those steps. Price, margin, churn, and CAC for one customer, before you apply a multiple, are the unit economics calculator.
What we tested
On November 20, 2026 this page opened the SaaS Capital index, the October 31, 2026 downloadable file, the index chart, SaaS Capital’s January 24, 2025 private valuation note, and the Aventis Advisors page published August 31, 2026. The multiples in the tables are the figures on those pages, rounded to two decimals where the file prints a longer median. The $1,000,000 sample is not a row in that file. No buyer’s offer was collected for it.
ARR calculator MRR times 12, or a list of annual contracts, before you multiply by a valuation multiple. Free tool How to calculate NRR The retention rate buyers ask about when a multiple moves. A different sheet from the $1,000,000 sample. GuideFAQ
What is a typical SaaS valuation multiple?
On October 31, 2026 the SaaS Capital Index median ARR multiple was 4.97x, and the index chart labels that point 5.0x. The 25th percentile in the same file was 2.67x and the 90th was 13.53x. Aventis Advisors puts the median listed SaaS company at 4.6x revenue in August 2026. A typical public reading is that cluster around 5x, not the 90th percentile.
What is the SaaS Capital Index?
The SaaS Capital Index is a set of public B2B SaaS companies. SaaS Capital’s index page, checked November 20, 2026, says the data is as of October 31, 2026, and that 63 companies are in it. The valuation multiple is market cap divided by annualized current run-rate revenue, which is the latest month of GAAP revenue times 12. The median of those multiples is the number they publish each month.
Are SaaS multiples based on ARR or revenue?
Both show up, and they are not the same denominator. The SaaS Capital Index multiple uses annualized GAAP revenue, which can include a setup fee or a service project. Aventis Advisors publishes EV/Revenue, and says a revenue multiple and an ARR multiple are close only when revenue is almost all subscription. Say which denominator you used.
What multiple do small private SaaS companies sell for?
Aventis Advisors, on a page published August 31, 2026, reports a 3.3x revenue median for SaaS deals under $5 million, 3.2x for $5 million to $20 million, and 3.0x for $20 million to $50 million. Those bands pool deals since 2015. The middle half of the $5 million to $20 million band ran from 1.7x to 5.8x. The all-deals median of 4.5x is a worse guide for a small sale than the size band.
Sources
- The SaaS Capital Index (SaaS Capital) Checked
- SaaS Capital Index downloadable data, October 31, 2026 (SaaS Capital) Checked
- SaaS Capital Index median chart, October 31, 2026 (SaaS Capital) Checked
- 2025 Private SaaS Company Valuations (SaaS Capital) Checked
- SaaS Valuation Multiples: 2015-2026 (Aventis Advisors) Checked